Ophelia Sin

I'm currently a second year master student at North Carolina State University studying Computer Science. Previously, I graduated from UCLA with a double major in Communication and Geography.
Find me on LinkedIn !
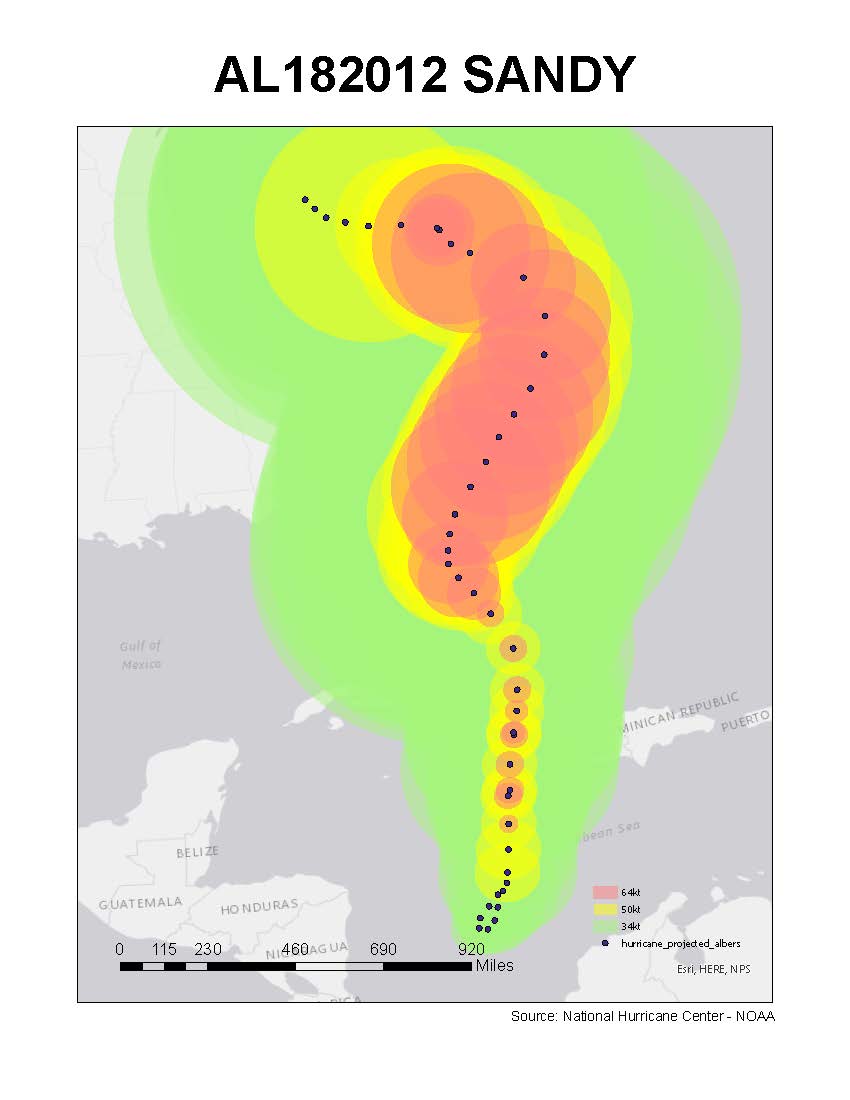
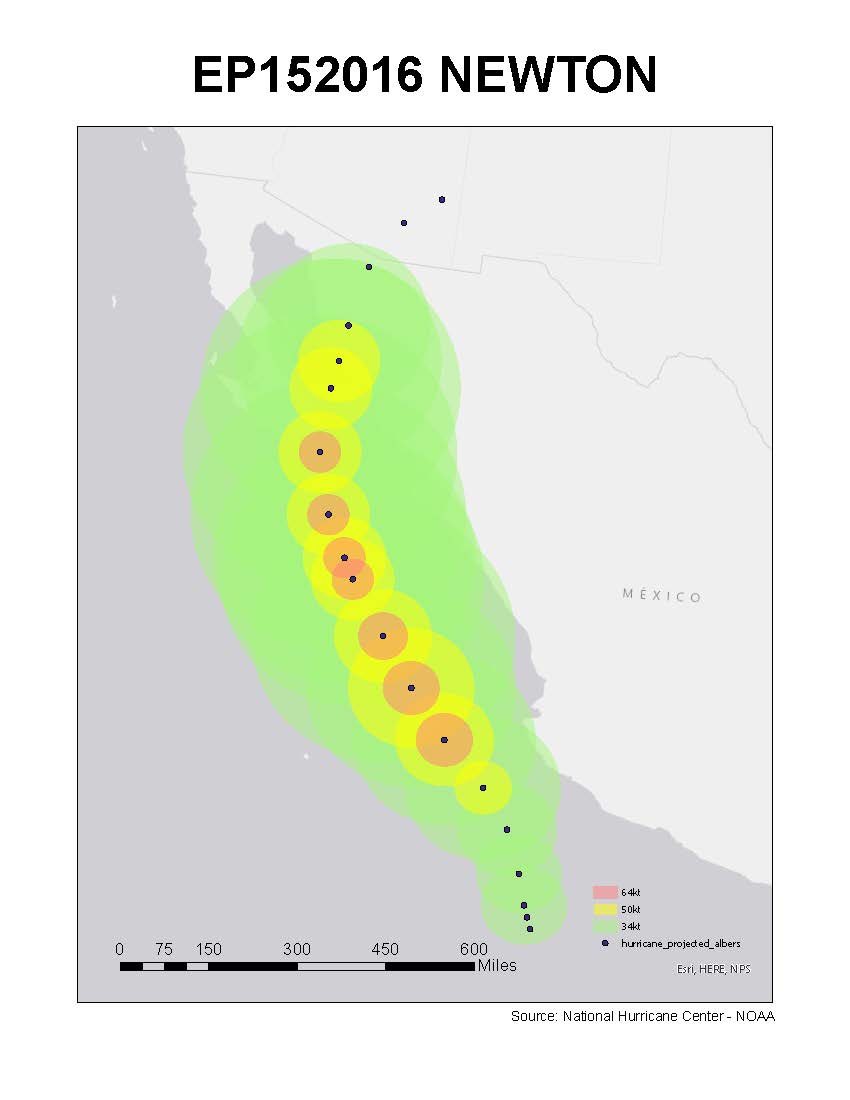
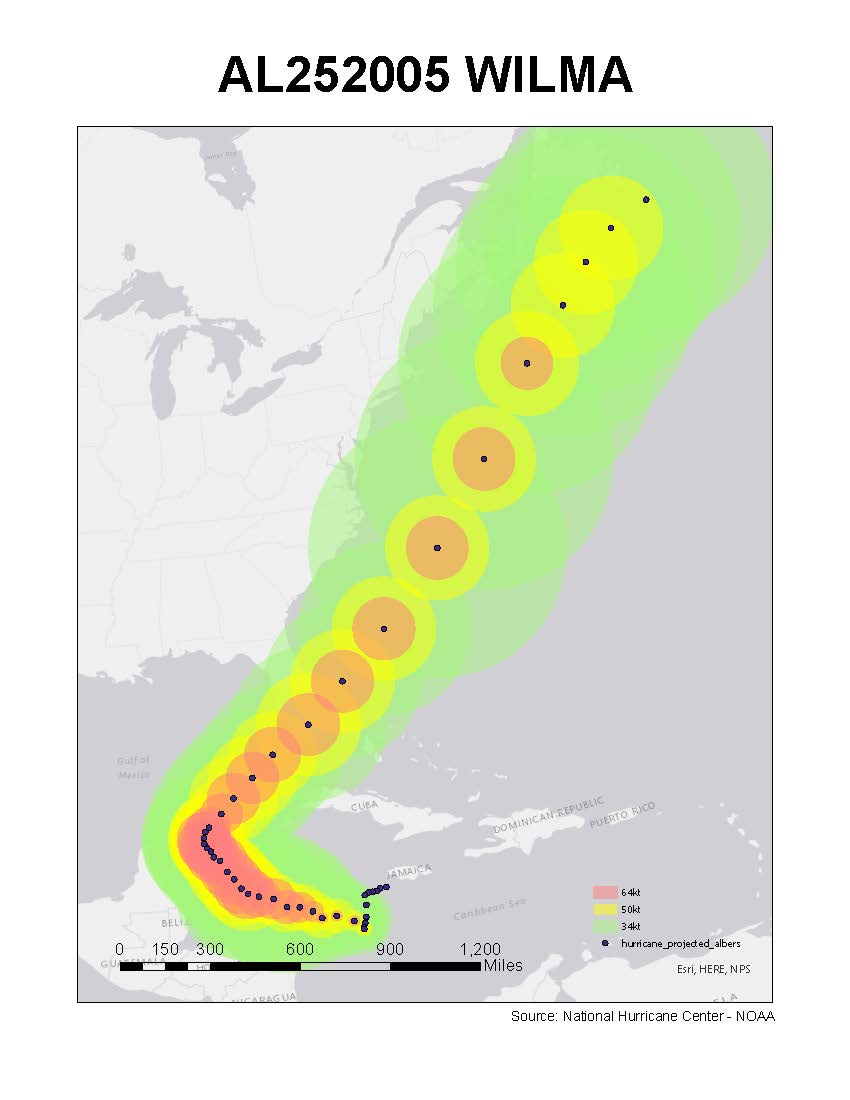
Hurricane Path Visualization In Continental U.S.
Goal: Using hurricane data from the National Oceanic and Atmospheric Administration (NOAA) and the HomeScan dataset collected by Nielsen, hurricane points are mapped with concentric circles of maximum wind speeds at different wind levels. Concentric circles are based on NOAA data. The radii are converted from nautical miles to miles for research purposes. Each hurricane path is visualized individually. Below are three examples of the twenty-nine maps I’ve created for Julia Levine (PhD student) at UCLA Anderson School of Management as a Research Assistant in March 2021.
Skills used: Queries, buffer analysis, map series
Software: ArcGIS Pro