Ophelia Sin

I'm currently a second year master student at North Carolina State University studying Computer Science. Previously, I graduated from UCLA with a double major in Communication and Geography.
Find me on LinkedIn !
Constructing a Funicular at Griffith Park in Los Angeles
Goal: The goal of this project was to construct a funicular track and two stations at Griffith Park in LA.
Methodology
This project applies three techniques I’ve learned from Geog 170: Least Cost Path Analysis, Viewshed Analysis, and 3D Visualization.
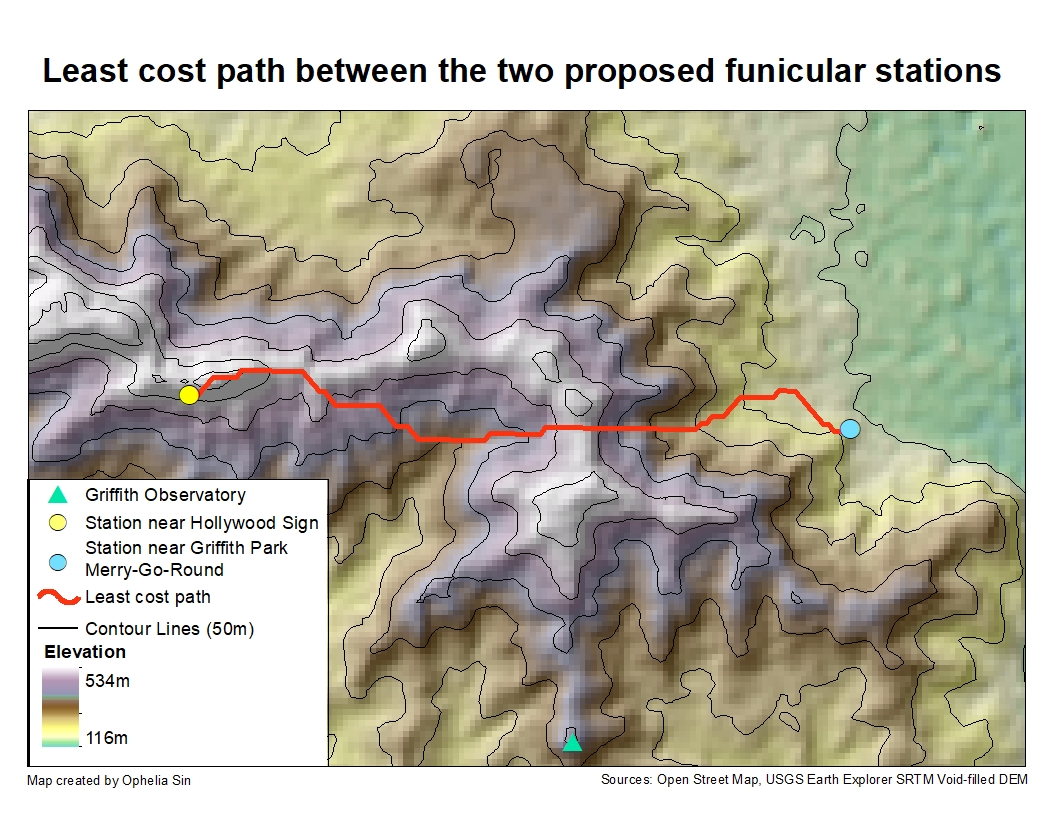
I selected two hypothetical station locations, one beside the Hollywood Sign and the other next to the Griffith Park Merry-Go-Round. Four factors were taken into account to calculate the cost of building a funicular track in this scenario: elevation, slope, existing building structures, and existing roads. In order to provide a scenic view along the ride, high elevation is ranked higher than low ones. With slope, the ideal slope is neither too steep nor too shallow. The energy needed to pull a funicular on a steep slope is high. A shallow slope would make the ride boring for travelers. Lastly, it would be costly and cumbersome to demolish a building structure to make way for the funicular. Building a bridge over an existing road is also going to increase the financial cost of constructing the track.
After calculating the least cost path, using the two hypothetical locations for the stations, I conducted a viewshed analysis to see whether the locations are optimal for observation. Assumptions were made to facilitate the analysis: first, the average traveler standing in the station is assumed to be 1.5 meters tall; second, the traveler is also assumed to be able to view at the farthest distance of 85 kilometers, as the stations are located on a mountain.
Finally, a 3D visualization is produced using qgis2threejs. This visualization includes the locations of the stations, the elevation, the least cost path, the viewable areas from each station, and the location of Griffith Observatory, and a satellite basemap.
Maps
The areas covered in blue and purple each represent the area that is computed using viewshed analysis from the station near hollywood sign and the station near the merry-go-round respectively.
Results
The Least Cost Path traverses areas with higher elevation while avoiding crossing too many roads and buildings.
Travelers are able to view different parts of the LA area at the two stations with little overlap.