Ophelia Sin

I'm currently a second year master student at North Carolina State University studying Computer Science. Previously, I graduated from UCLA with a double major in Communication and Geography.
Find me on LinkedIn !
Spatial Dynamics Of The 2012 And 2016 U.S. Presidential Elections
Goal: The goal of this project was to learn more about the spatial dimension of voting behavior and election outcomes in the U.S. Spatial clusters are identified and assessed.
Methodology
GeoDa was used to generate spatial weights matrices and calculate global and local Moran’s I values. The spatial weight in this analysis used queen contiguity of order 1. In order to explore the spatial dynamics of the elections, directional local spatial autocorrelation analysis was performed.
ArcMap were used to visualize output from GeoDa’s local spatial autocorrelation tool.
Maps
Discussion
Overview of the spatial distribution of voting behavior
Voting behavior tends to be clustered, evenly dispersed, or randomly distributed. Calculation of Global Moran’s I values of the percentage change between the 2 elections for both Democrats (0.646) and Republicans (0.637) show that there is positive spatial correlation.
A strategic discussion of the spatial dimensions of the aforementioned local spatial autocorrelation analysis:
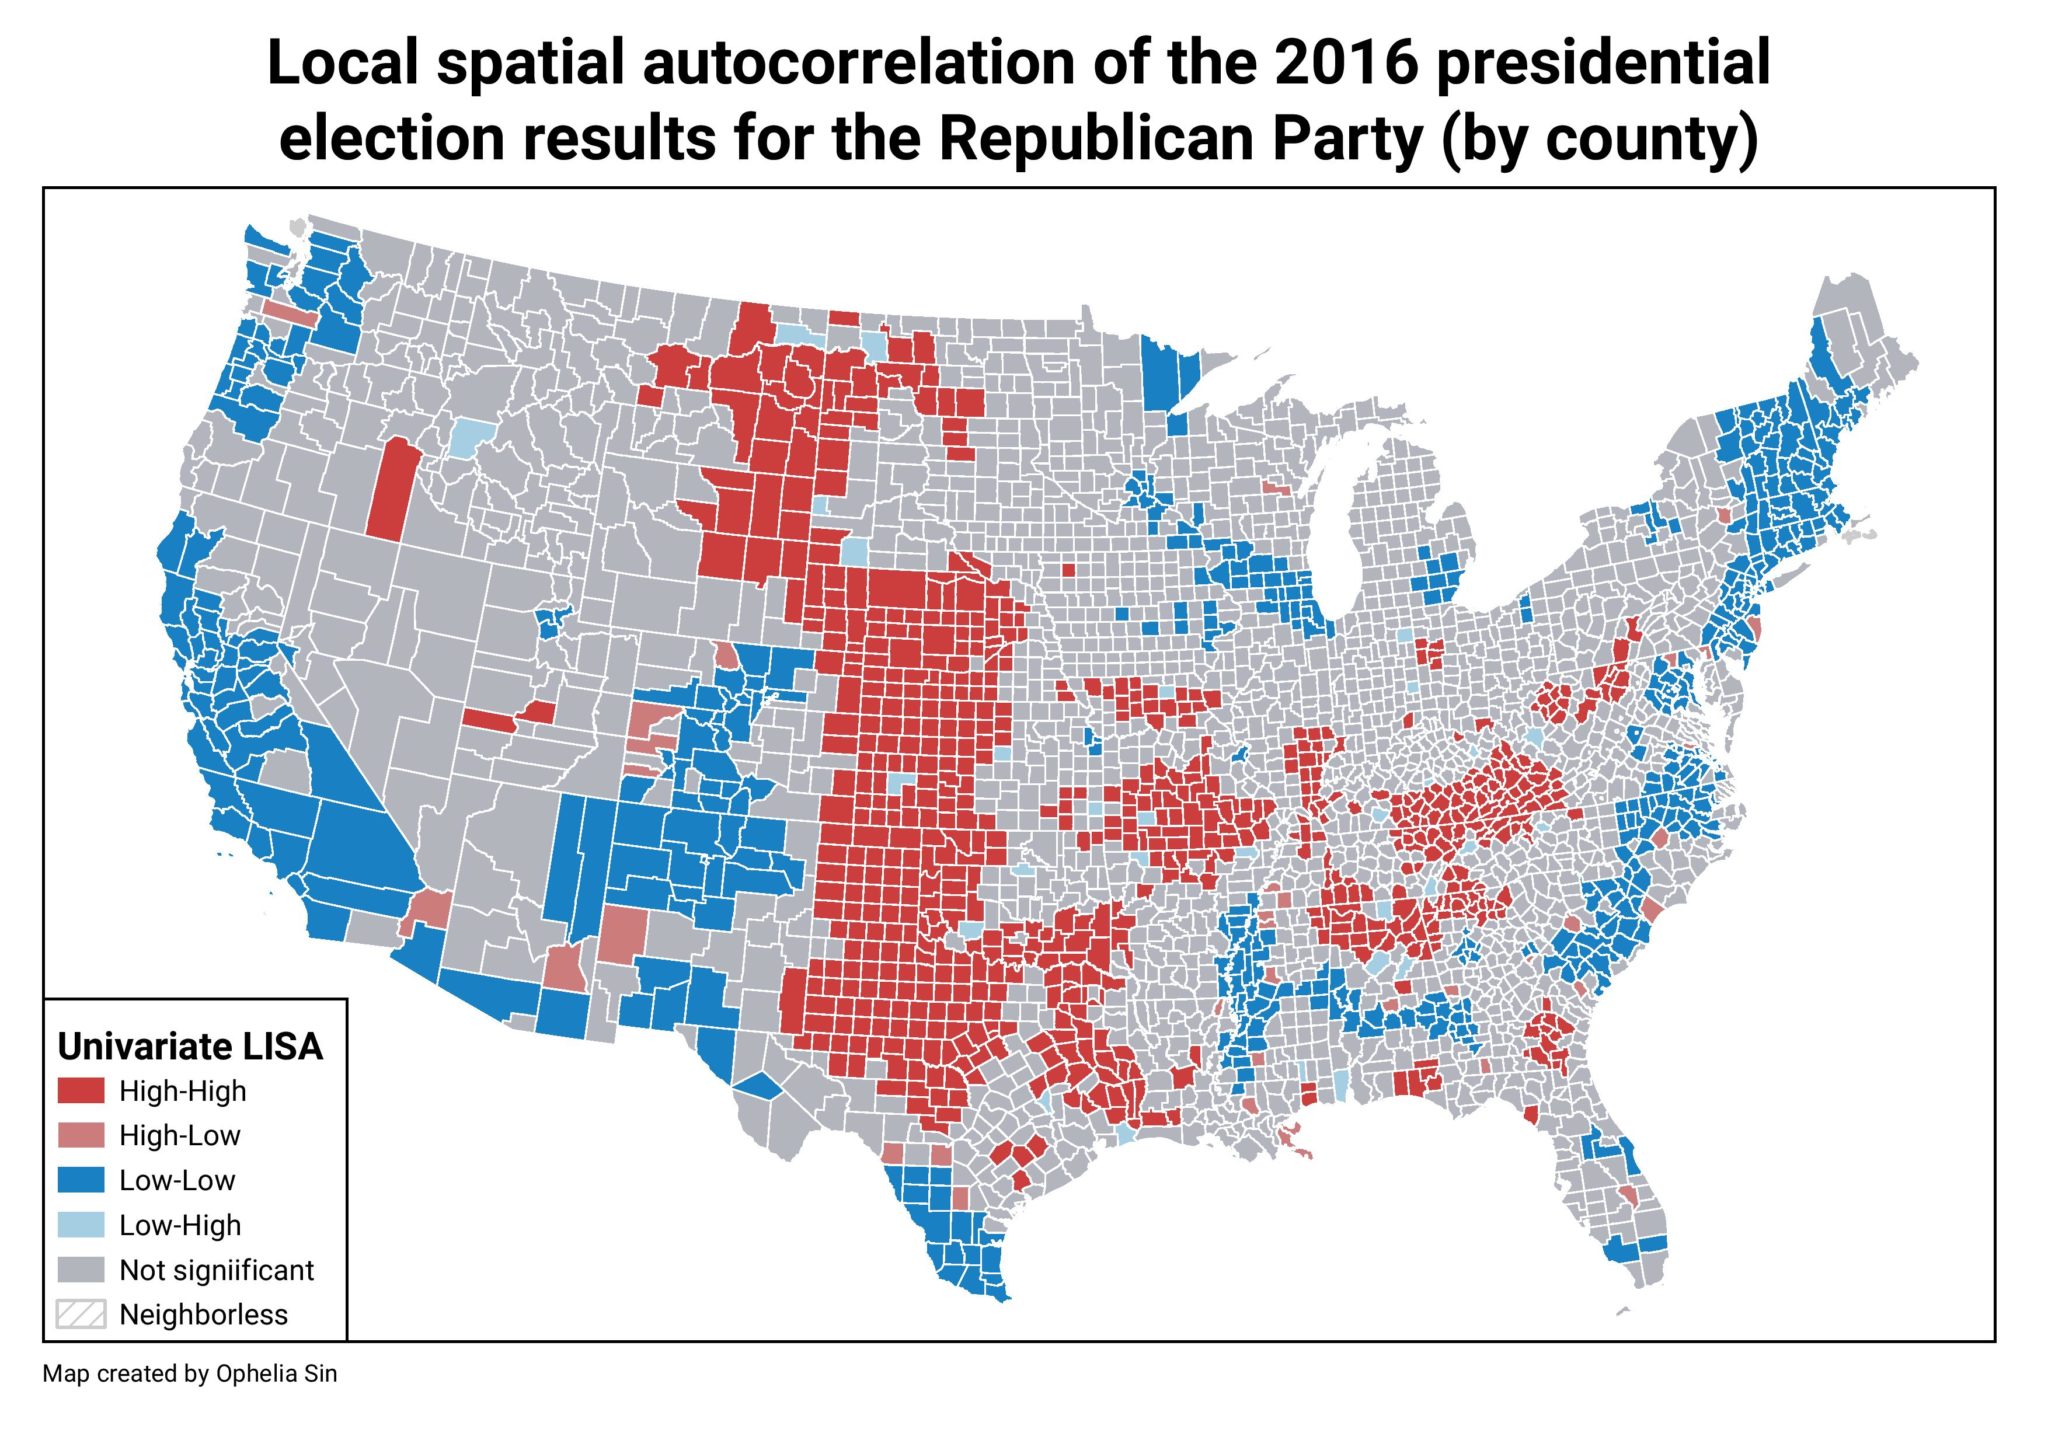
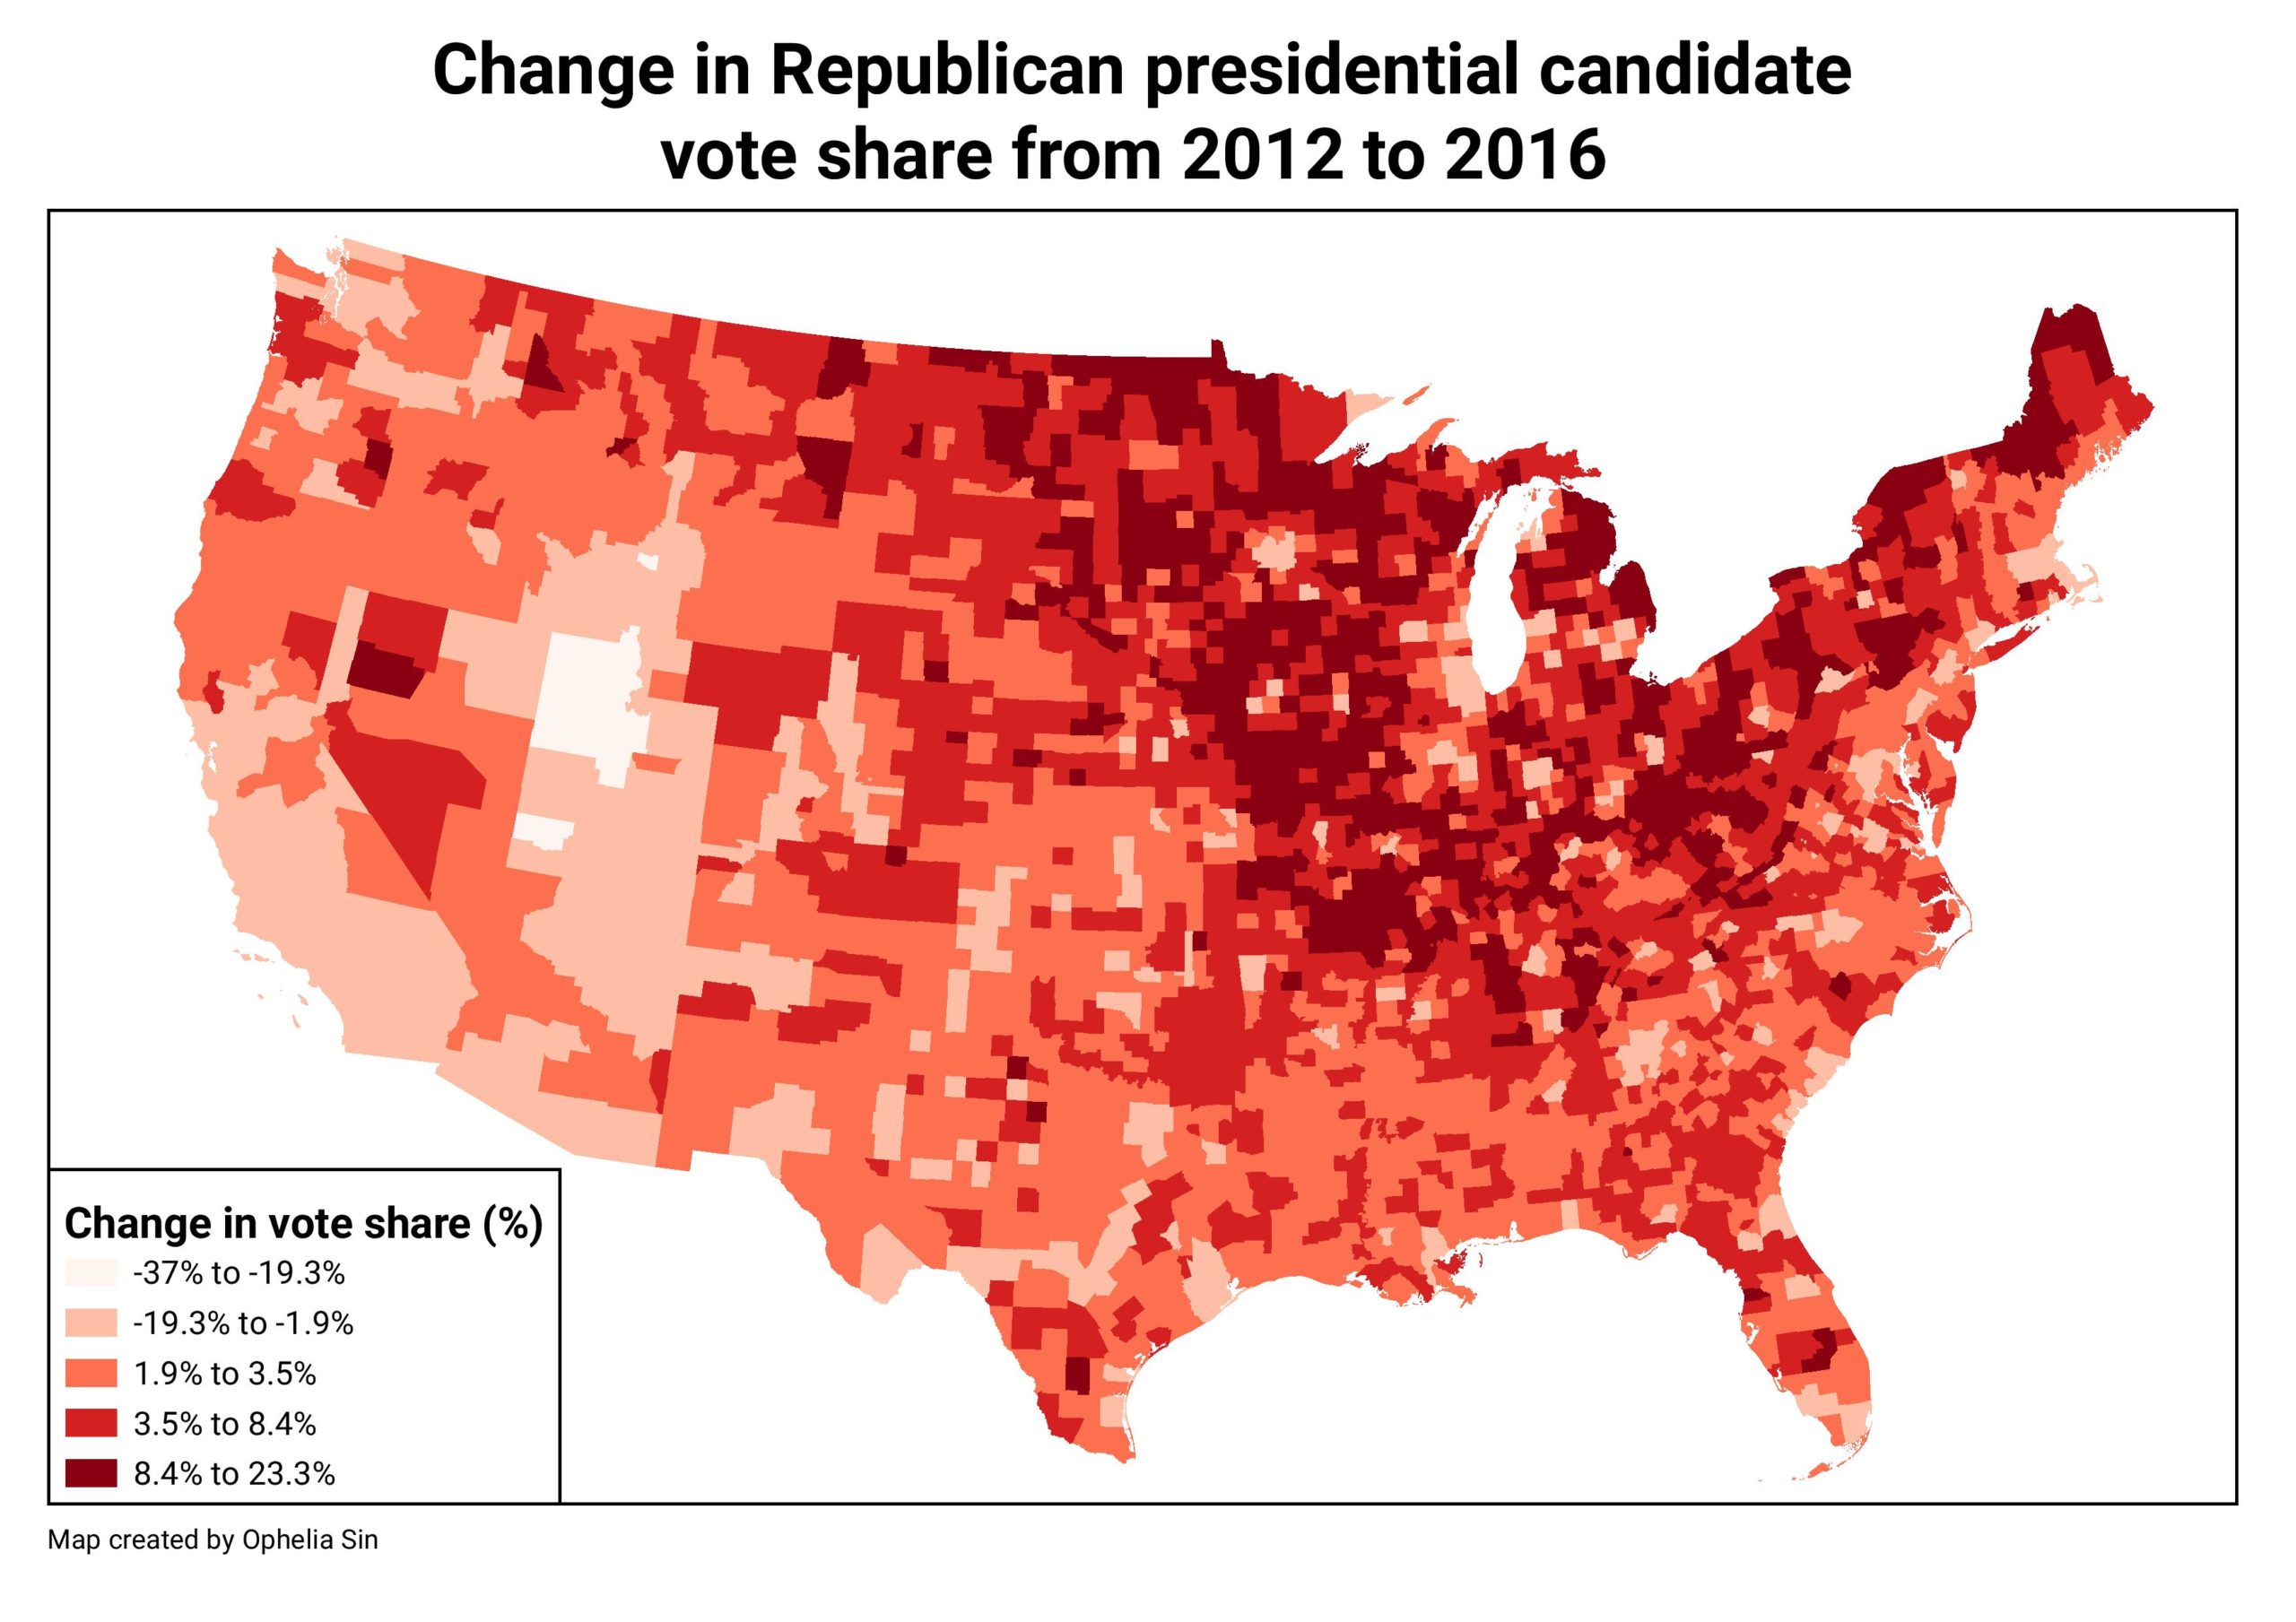
In the LISA maps in 2012 and 2016, clusters can be identified in the Pacific coast (California and Washington), the midwest (Texas, Oklahoma, Kansas, and Nebraska) and the northeast (Maine, Massachusetts, New Hampshire, Vermont). Clusters have shifted between the years. In 2012, there was a High-High cluster in Utah. It disappeared in 2016 and the HighHigh cluster shifted up north to Montana and Wyoming. Low-Low clusters have also changed. In 2016, Low-Low clusters in the rust belt have decreased in size, whereas those in the Pacific Coastline have increased in size. The change in vote share map also reflects the clusters shown in the 2016 map. The rust belt region shows a significant increase in Republican vote share, whereas California shows a significant decrease in Republican vote share. The median income of states with High-High cluster varies. In the upper Midwest, the states have low median income and in the rust belt, most states have medium median income. The presence of these clusters mean that Tobler’s first law of Geography is existent – especially near things are more related to one another. Therefore, in order to gain an edge on the next election, the candidate must secure its current strongholds and campaign in those nearby areas to maximize the applicability of Tobler’s first law.
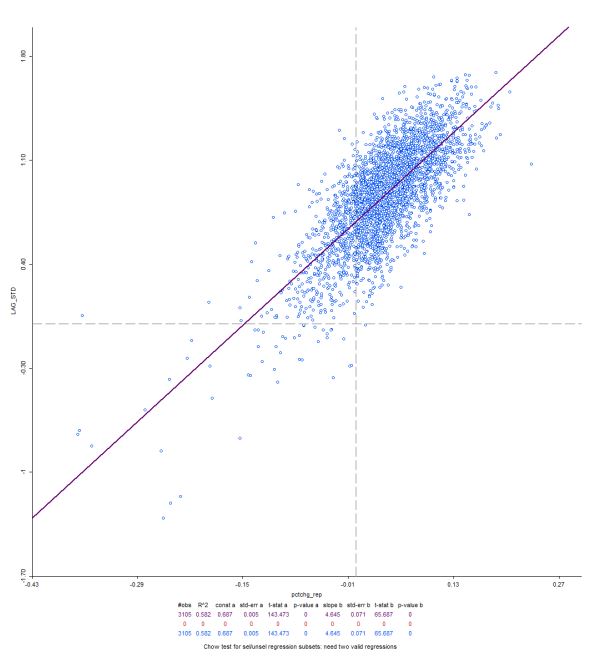
In this scatterplot, we see that values are concentrated in the upper right scatterplot, which indicates an increase in the percentage change for republican vote share in the variable itself and its neighboring values. This shows that there was a huge change in voter behavior across most of the country. Points on the upper end of the High-High box represents counties in the upper Midwest, the rust belt, and deindustrialized areas. In order to maintain dominance in areas with a Republican stronghold, the party has to win in the next election, the Republican Party has to increase support in counties that are currently located near the origin point to win electoral votes in swing states.